@tlas Insights
- Cheap Words
- Commission Plans
- Comp Plans
- Contract Tips
- Convertible Notes
- Dilution is your friend
- Finplan Vs. Budget
- Focus Kills Companies
- Freemium Vs. Premium
- Funding Process
- Let's Change Topics
- Sales Pipeline
- Sales Expectations
- Significant Digits
- ST Goals
- The Nerd's Prayer
- To Better Days
- Top Ten Failures
- VC Tips
- Your Pitch
Three Things to Talk About
There are three deal terms that have become common practice and we’d like to start a discussion about them. My intent here is to provoke thought, so I’ll take one side with a simplified argument. Let’s get it started by saying that we’ve had enough of “burn rate”, EBITDA as a shorthand for earnings, and non-participating preferred stock.
Burn Rate
I asked a few sophisticated investors how they define burn rate. My favorite was from Ian Sobieski (he runs the Band of Angels): From month to month the change in the cash position of the company...I accept no other mumbo-jumbo...
This one works but, even among some sophisticated angels and credible VCs, I received a variety of definitions that were at odds with one another and too often were based on this month’s P&L.
Forget about the crazy connotations of burn rate (“you may as well set fire to the money you invested in this company”), for most people, burn rate comes from the P&L (it’s the monthly loss) but it’s unclear whether the effect of revenue is included or not and it doesn’t provide the data needed to estimate how much cash the company requires to operate.
A typical startup might spend $70k/mo before revenue but $50k after considering revenue. If you insist on talking about burn rates using the P&L, qualify the metric with “including the effect of revenue” and use that measure since most people are (sadly) going to use this to determine how long your cash will last. Without this qualifier, an investor will see a $1MM raise and $70k “burn” and calculate 14 months of cash. If you quality that the net burn is $50k net burn, then $1MM says you are raising capital for 20 months.
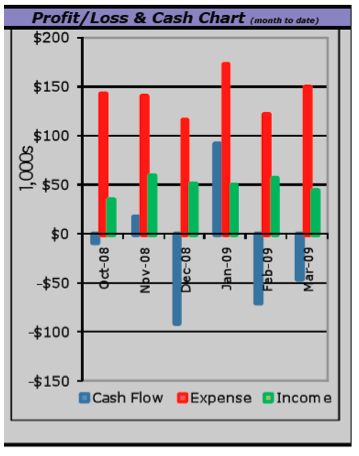
And now we see the other problem: burn rate provides a metric that supports flawed interpretations. This is because the actual rate at which companies consume cash is both inconsistent and trending over time. Take Inlustra, one of our portfolio companies. Here you see their anticipated cash needs for a six-month period. If you asked them in October what their burn rate was you would hear: “$150k but $110k after revenue”, or maybe: “about $10k negative cash flow”. It’s apparent from the chart here that there is no simple answer based on a “rate” that you can see in October.
The answer the investor really wants to know is: “how long will the cash in the bank (or in this round) last according to plan (or assuming no new revenue or 50% of revenue or some other scenario)?” Or: “how much cash do you need to run the business for the next n months assuming you achieve plan?”
Inlustra typifies a company with sporadic changes to expense levels and cash flows (they own and have leased a good deal of hardware). Even if we are willing to accept that the P&L produces a reasonable proxy for cash flow (it usually does except where there’s a material amount of depreciation, deferred revenue, or delayed AP (all of which occur regularly), burn rate net of revenue still leads to bad decisions.
But it’s not just manufacturing companies that have problems with this simple metric. Burn rate for standard software companies will also produce incorrect conclusions. The expenses and revenues for most startups trend upward over time but at varying rates. If the slopes of the expense and revenue lines are equivalent over the time horizon in question, then burn rate net of revenue can be a reasonable gauge for a company’s cash requirements. But that’s rarely the case. Here’s approximate, rounded data from an investment company of ours during 2009:
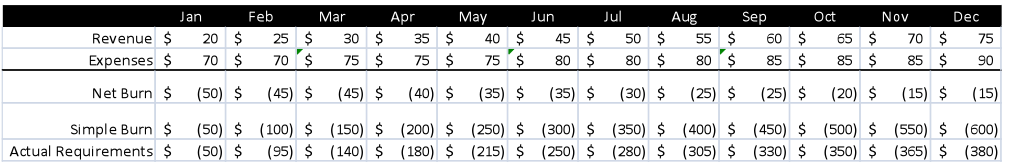
This business is growing toward profitability and was seeking $500k to get there. If investors used the burn rate of $50k, they would have incorrectly concluded that the company would run out of cash in ten months. In fact, this business was set to break-even in April of the following year after consuming $400k. Using the shorthand burn rate miscalculated cash required at the end of year by 58%. Decisions are made based on this number: decisions to invest or not to invest, decisions of viability, and rankings (in investors’ minds) of your deal versus others with regard to expense levels, profitability, and cash requirements.

The short answer here is that there is no short answer. There is no simple way to modify burn rate. Next time someone asks what yours is, try something like: “current expenses are $50k greater than revenues. According to plan, we’ll need $400k to reach profitability which is expected in April of next year. We’ll need $380k to get through to December, when our expenses will be $15k greater than revenues.” Saying $70k or $50k just won’t cut it. And if you have material deferred revenue, depreciation, or AP than can be delayed, your answer has to be still more detailed to cover that.
EBITDA
Somewhere there’s a startup book that told everyone to use EBITDA as their quick measure of profitability. When you make your quick pitch to investors, they always want to see the high-level summary of your five-year plan. We often see this as Revenue and EBITDA. But I always wonder what the presenter is trying to hide. Most of the presenters don’t really understand EBITDA and how easily it can be manipulated with assumptions or policies regarding capitalization of assets. For instance, most software startups don’t amortize software development in their pro-formas but what if yours does? You’ll be showing a very different story to investors.
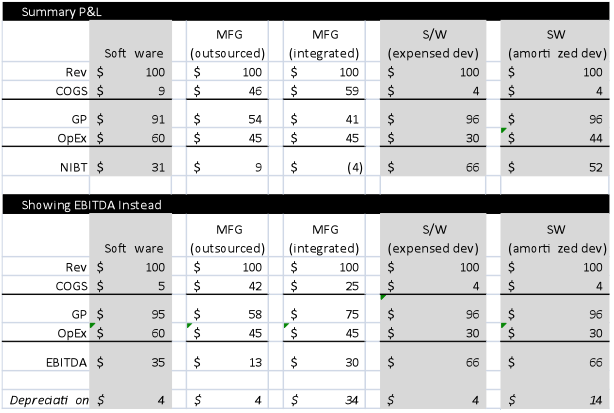
The first column of numbers here shows a typical software company with moderate depreciation for servers or other hardware. NIBT (Net Income Before Tax), shown in the top section, is about the same as EBITDA (Earnings Before Income Tax, Depreciation, and Amortization), shown below.
In some cases, EBITDA can become misleading. Look at the manufacturing companies in the next two columns. These numbers are similar to figures we considered regarding plastics companies. Both companies have and $4 of depreciation on final assembly equipment. But the first company buys feedstock from a contract manufacturer. Their COGS equals the $4 of deprecation on equipment plus $25 in labor and $17 in contract manufacturing charges. The second company is vertically integrated and has a good deal of capital equipment (the depreciation associated with that equipment is part of Cost of Goods Sold) to do so. Their COGS equals the same $4 in depreciation and $25 in labor for final assembly but also $34 in depreciation for capital equipment that produces the material for production. If we used EBITDA, the integrated firm looks more attractive. What is the second company hiding? A massive investment in capex that is required, making their business model far less interesting.
Most software companies don’t capitalize software development in their forecasts and probably should not. It’s a needless complexity caused by an accounting fiction. But a few, certainly later stage ones, should (companies preparing for an IPO or sale to a public company). Again, EBITDA is the same for the two companies at the far right of the table but the company with no amortization is actually twice as profitable. It is spending the same amount in operating expenses as its less-profitable comparable but it produces the same revenue without having to have made the capital investment.
If you have only one profitability number to offer, use NIBT.
Non-participating Preferred
Liquidity preference is one of the two most important aspects of preferred stock (the other is anti-dilution protection). In recent history, the two most common liquidity preferences have been 1x participating and 2x non-participating preferred. For clarity (there are subtleties to the nomenclature): 1x participating means that, upon liquidation, investors receive their investment back first (one time: 1x) then participate in distribution of the remaining assets on an as-converted basis along with the common. Non-participating preferred holders must choose between getting their liquidation preference (two times or more of their investment) or converting to common. From a practical point, the company will calculate the alternative returns and will pay out the greater of the two values. As you can imagine, there’s a cross over point, when the liquidation preference is paid in full, where the conversion makes sense. The unfortunate side to this, however, is the misalignment with management.
Let’s consider an investment of $3MM on a $5MM pre-money. The investors in this case own 38% of the company and are considering a 1x participating preferred or a 2x non-participating preferred.
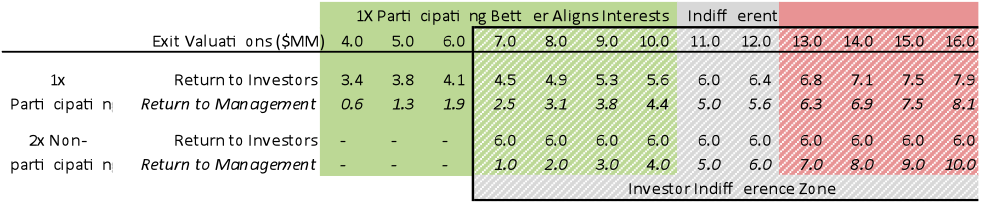
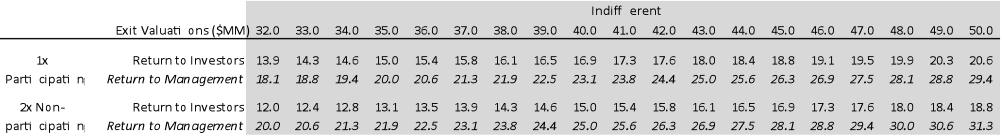
The below table is nearly impossible to read, so I’m going to repeat it in sections.
The table shows four colored sections in the columns and one shaded overlay that’s labeled at the bottom. There are three sections in rows. Across the top of the full table above, we see exit values from $4MM to $50MM. In the rows, we see the return to investors and management for a 1x participating preferred, then the same for the 2x non-participating preferred.
As exit values under a 2x of the pre-money (it’s no coincidence that the cut-off point is the same as the liquidation preference times the pre-money valuation), we see that the return to investors is superior with the 2x non-participating. But in this range we have a potential conflict. What if the company’s prospects diminish and the prudent course of action is to sell the business at a low value, say $6MM? If investors have a 2x liquidation preference, management will have no interest in such a sale. To a lesser degree, this same problem exists on potential sales up to $10MM as the return to management is poor.
Next, there’s a brief range where the difference to management is under 10%.
Now look to the shaded overlay labeled “Investor Indifference Zone”. Since investors’ returns do not change between exit values from $7MM - $16MM, they would have no desire to improve deal terms; if it appeared that a sale was the best alternative, investors would take their $6MM regardless of whether the sale price was below the $8MM post or double it!
At exit values between $13MM and $31MM (about 2.5x to 6x returns – by far the most common return multiples for successful exits), investors fare 10% - 20% better with a 1x liquidation preference. Within this range, interests are clearly aligned as management and investors’ returns improve at the same rate using the 1x participating preferred. Using the 2x non-participating, interests are not aligned at the lower end.
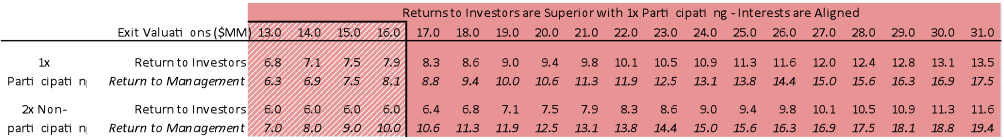
If we continue this up to a 10x return (on the pre-money) of $50MM, we see that 1x participating preferred produces a benefit to investors of <10% at any given exit value. I’ll label that as indifferent.
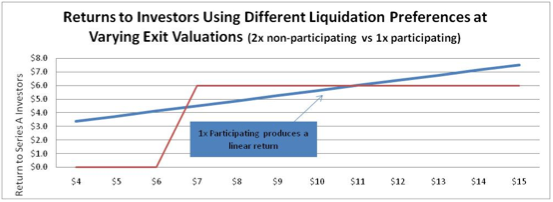
We talked about the slopes of the lines. The chart below shows us how a non-participating preference can create mixed incentives. It’s a gamble. As an investor wanting 2x non-participating, you’re gambling that the company might sell for a low value and you’re willing to give up upside. As an entrepreneur, you’re gambling that you’ll produce at least a 2x return. Let’s think more about this.
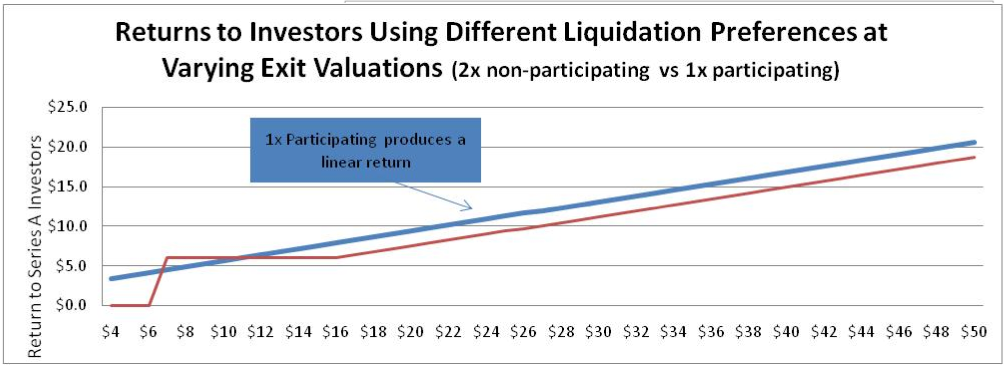
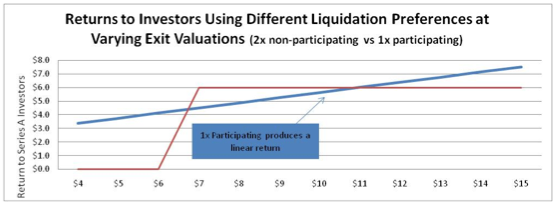
If you’re an entrepreneur selling a 2x non-participating preferred, you’re gambling that you’ll produce a better than 2x return on sale. Recent data showed that 28% of all venture success (when there was some consideration at exit – not a bankruptcy) sold for under a 2x return. The return to entrepreneurs averages about 15% less in the 2.5x – 6x return range. So, by desiring 2x non-participating preferred, you’re giving up ALL of your opportunity for 28% of your potential exits in order to get an extra 15% upside on exit values where your marginal utility of that capital is quite diminished. Does that trade off really sound like it’s worth it? And to make this less interesting, remember that non-participating deals are usually harder to sell to investors. The median multiple for venture –backed exits was recently reported at 3.8x. By selling 2x non-participating, you’re betting that you’re not going to be in that lower quartile and you’re betting your entire upside on that.
I mentioned that we occasionally see 3x non-participating. As you would guess, such terms exacerbate the misalignment. Here’s what that chart looks like.